

Firecrawl holds Google's #1 spot for this query on a glossary page. That page names Firecrawl the best API for JavaScript-rendered websites. In scrape.do's independent, open-source benchmark, Firecrawl scored 60.47%, fifteenth out of sixteen providers. In Scrapeway's separate Cloudflare test, it landed at 46%.
That gap is the reason this post exists. Say you're a developer choosing where to send production traffic. "We rank ourselves first" is not data. Measured success rates are.
Here's our position up front. DataBlue wasn't in either benchmark. Both were run by vendors who show up in their own results, so you should read every number with that in mind. We're citing them anyway. They are the only public, reproducible numbers that exist for this question. So we'll show the methodology, flag the conflicts of interest as we go, and then run the one calculation nobody has published. What does a successful request actually cost?
What "JavaScript rendering support" actually means on a pricing page
When a vendor's marketing says it supports JavaScript rendering, three different capabilities collapse into one bullet point. You need to decode them separately when comparing providers. They're priced separately and they fail separately.
The render=true flag. This is the base capability. Instead of a plain HTTP request, the API spins up a real browser and executes the page's JavaScript. It returns the rendered DOM. On almost every provider, flipping this flag costs 5-10× the credits of a non-rendered request. A plan that quotes a per-request price for HTML fetching often quotes the cheap path. The moment you need a React or Next.js page hydrated, your effective rate multiplies. This is the single most common billing surprise in the category.
Wait conditions. This is where most rendering failures actually live. It's the least-documented feature on every pricing page. There are three strategies, and they are not equivalent:
- Fixed delay covers "wait 5 seconds, then grab the DOM." Simple, and wrong often enough to hurt. Slow pages aren't done. Fast pages waste your latency budget.
- Wait-for-selector blocks until a specific element appears. Reliable, but you have to know the selector in advance and maintain it when the target's markup shifts.
- Network-idle waits until in-flight requests settle. Best for content loaded by XHR or fetch after paint. It hangs on pages that poll or stream.
Say a provider only offers a fixed delay. Expect intermittent empty responses on any target with variable load times. That's not a bug you retry your way out of cheaply.
Post-render actions. Scroll to trigger infinite scroll or click to expand a section. Most job boards and marketplaces lazy-load their data, so you need this. Providers that offer it usually meter each action.
The buying question cuts through all of it. Does the price you were quoted include rendering, or is it the non-rendered rate? Ask before you commit volume.
Maybe you need the underlying mechanics behind why the DOM in DevTools isn't the HTML your HTTP client gets. That's covered in depth on our JavaScript rendering explainer. The HTTP vs. browser rendering guide walks through when each approach is the right call. This post assumes you already know you need rendering. Now choose who to buy it from.
Benchmark results: 16 APIs on 7 hard targets
The numbers below come from an open-source benchmark that anyone clones and reruns. That reproducibility is what makes them worth citing at all. So here's exactly how they were produced before you read the table.
The methodology. The test hits the seven hardest commercial targets on the web. Those are Amazon, Indeed, GitHub, Zillow, Capterra, Google, and X, each combining heavy JavaScript rendering with active anti-bot defenses. For every provider, the harness fires hundreds of requests per domain, all at the same time of day, spread across multiple runs to smooth out transient failures and IP-reputation swings. Success is not a 200 status code. A 200 that returns a challenge page or an empty shell is a failure. The harness validates each response by checking the returned HTML for specific expected elements, like the product title or the price node. It only counts as a success if the real content is present.
That element-level validation is why these success rates are lower and more honest than the "99.9% uptime" figures on vendor homepages. Uptime measures whether the API answered. This measures whether it answered with your data.
The conflict of interest, stated plainly: this benchmark was built and run by scrape.do, which placed itself second in its own results. We're telling you that because you should trust a source more when it discloses its stake, not less. Second is a defensible, non-greedy placement. The tell of a rigged benchmark is the host at #1 by a suspicious margin, and that's not what happened here.
| API | Success rate | Avg response | Starting price | Price /1k |
|---|---|---|---|---|
| Bright Data | 98.87% | 12.7s | Pay-as-you-go | $1.50 |
| Scrape.do | 98.61% | 5.9s | $29/mo | $0.60 |
| Apify | 97.14% | 8.4s | $39/mo | $5.48 |
| ScrapingBee | 96.62% | 7.1s | $49/mo | $1.77 |
| ZenRows | 96.29% | 6.8s | $69/mo | $3.32 |
| Oxylabs | 95.40% | 9.2s | Pay-as-you-go | $7.00 |
| Decodo | 94.20% | 6.3s | $30/mo | $0.71 |
| Scrapfly | 93.86% | 7.9s | $30/mo | $2.85 |
| WebScrapingAPI | 92.10% | 8.7s | $49/mo | $5.25 |
| Zyte | 91.43% | 10.1s | Pay-as-you-go | $1.29 |
| ScrapingDog | 89.14% | 4.0s | $30/mo | $0.47 |
| ScrapegraphAI | 83.81% | 11.4s | $20/mo | $5.33 |
| ScraperAPI | 72.57% | 6.6s | $49/mo | $4.25 |
| ScrapingAnt | 68.14% | 33.1s | $19/mo | $3.56 |
| Firecrawl | 60.47% | 3.9s | $16/mo | $9.59 |
The spread is the story. The top five cluster tightly between 96% and 99%. Then success rates fall off a cliff. Below 90%, you're building retry logic into your pipeline whether you planned to or not. Below 70%, that's ScraperAPI and Firecrawl, retries aren't an edge case. They're the primary cost driver, and that changes the economics completely, as the next section makes plain.
Cost per successful request
Every price in the table above is the advertised rate for a request the API answers. But you don't pay for answers. You pay for data. When a provider succeeds 60% of the time, you're buying roughly two failed requests for every three you send. On most billing models, failures still cost credits.
So the number that actually matters isn't advertised price. It's advertised price divided by success rate, the effective cost per request that returns your data.
| API | Advertised /1k | Success | Effective /1k |
|---|---|---|---|
| ScrapingDog | $0.47 | 89.14% | $0.53 |
| Scrape.do | $0.60 | 98.61% | $0.61 |
| Decodo | $0.71 | 94.20% | $0.75 |
| Zyte | $1.29 | 91.43% | $1.41 |
| Bright Data | $1.50 | 98.87% | $1.52 |
| ScrapingBee | $1.77 | 96.62% | $1.83 |
| Scrapfly | $2.85 | 93.86% | $3.04 |
| ZenRows | $3.32 | 96.29% | $3.45 |
| ScrapingAnt | $3.56 | 68.14% | $5.22 |
| Apify | $5.48 | 97.14% | $5.64 |
| WebScrapingAPI | $5.25 | 92.10% | $5.70 |
| ScraperAPI | $4.25 | 72.57% | $5.86 |
| ScrapegraphAI | $5.33 | 83.81% | $6.36 |
| Oxylabs | $7.00 | 95.40% | $7.34 |
| Firecrawl | $9.59 | 60.47% | $15.86 |
The headline result: Firecrawl's effective cost per successful request is roughly 30× ScrapingDog's, or $15.86 versus $0.53. That is not a typo, and it's not explained by feature differences. It's the compounding of a high advertised price with a low success rate.
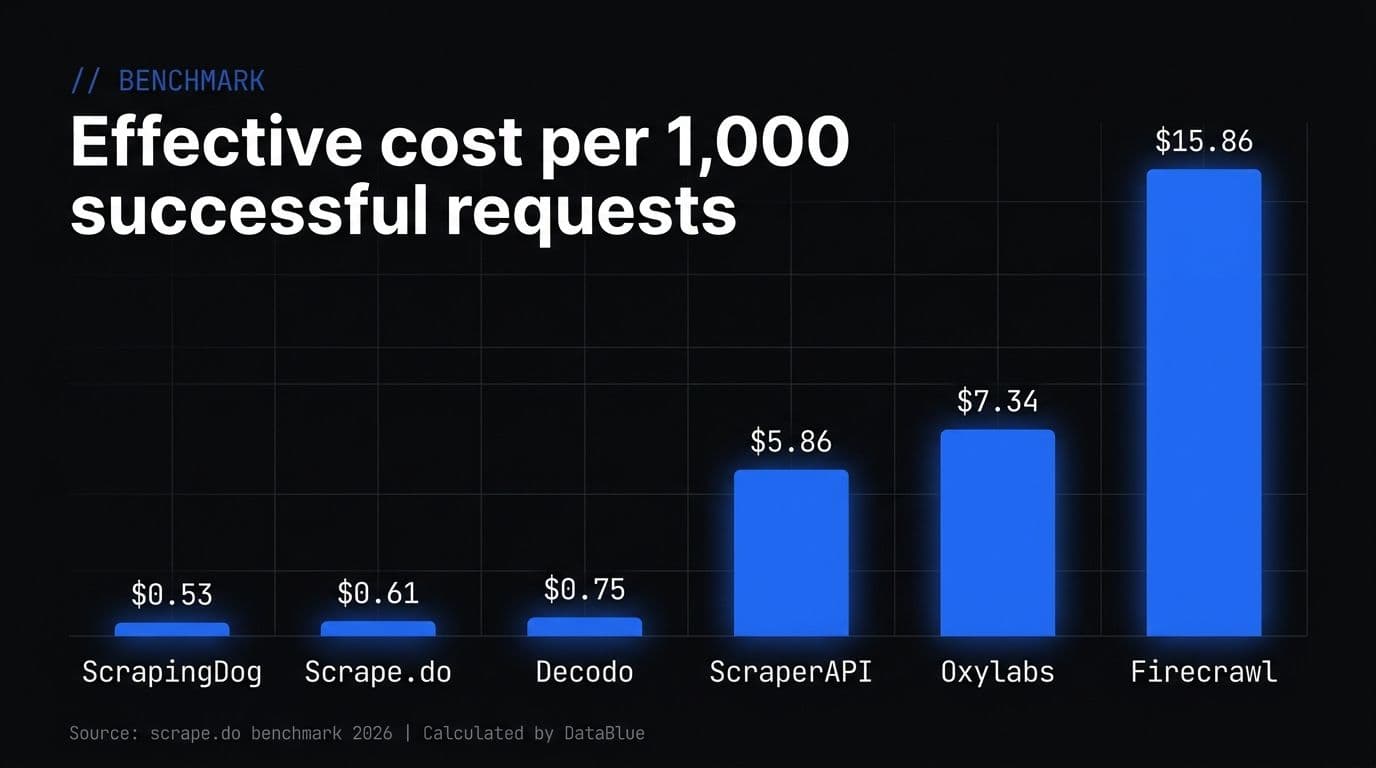
Here's the mechanism people miss. At a 60.47% success rate, you need about 1.65 attempts to land one success (1 ÷ 0.6047). Every one of those failed attempts is billable. So the $16/mo plan that looked like a bargain quietly charges you for 1.65 requests every time you want one page. If you've wrapped your scraper in a retry loop, and you have, that multiplier is invisible in your code and very visible on your invoice.
The reordering is dramatic. ScraperAPI advertises at $4.25/1k, cheaper than Apify and half the field. Adjusted for its 72.57% success rate, it climbs to $5.86, pricier than Apify's $5.64 despite Apify's higher sticker price. ScrapingAnt looks mid-priced at $3.56 and lands at $5.22. Meanwhile the two cheapest effective options, ScrapingDog and scrape.do, are affordable precisely because they pair low advertised rates with high reliability. Reliability is a discount.
Notice what happens to the top of the reliability chart. Bright Data's 98.87% success rate, paired with a modest $1.50 advertised price, produces a $1.52 effective rate. Barely any penalty, because almost nothing fails. That's the whole point of measuring this way. A high success rate isn't a nice-to-have. It's a direct multiplier on everything you spend.
Say Firecrawl is currently in your stack on the strength of its marketing. This is the number to model before your next billing cycle. We've written a fuller breakdown in our Firecrawl alternative comparison.
One caveat, stated clearly. These are as-tested figures. Pricing pages change, plans get renamed, and success rates drift as targets update their defenses. Treat the effective-cost column as a method to reproduce, not a permanent leaderboard. Verify each advertised price against the current pricing page before you commit.
Speed vs. success: the tradeoff nobody prices
Response time and success rate pull in opposite directions. Most comparison posts report them as if they're independent. They aren't. Which one you optimize for should be a strategic architectural decision, not an accident of whichever number the vendor advertises louder.
Look at the extremes. ScrapingDog returns in 4.0 seconds at 89.14%. ScrapingAnt takes 33.1 seconds at 68.14%, more than eight times slower and meaningfully less reliable. There's no tradeoff being made there. It's simply worse on both axes. When one provider dominates another on both speed and success, the decision is made for you.
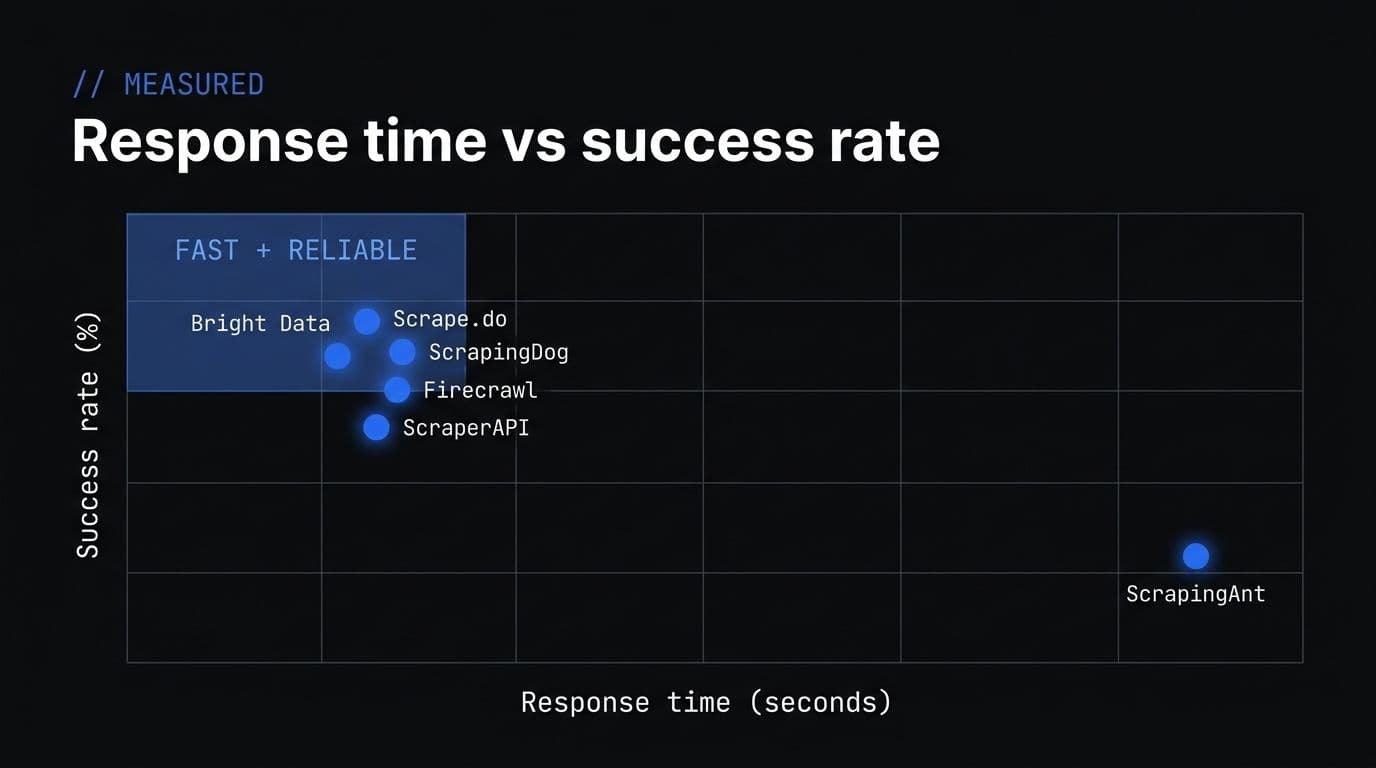
The real tradeoffs are the ones where you pay for reliability with latency. Bright Data buys its category-leading 98.87% success rate at 12.7 seconds per request, more than three times ScrapingDog's response time. That's a genuine engineering choice, and the right answer depends entirely on your workload:
- Real-time and agentic workloads weight latency. Say an LLM agent waits on a page fetch to continue a reasoning loop, or a user watches a spinner. 12.7 seconds is unacceptable and a marginally lower success rate you retry around is the better deal. Interestingly, Firecrawl is the fastest provider in the table at 3.9s. But that's fast failure. A 3.9-second response that returns an empty shell 40% of the time is worse than a 6-second response that returns your data. Speed benchmarks that ignore success rate systematically flatter providers like this.
- Batch pipelines weight success rate. Say you're scraping 200,000 product pages overnight. Nobody's watching latency. You care about how several pages you re-queue in the morning. Here Bright Data's 12.7s is nearly free, and its 98.87% success rate saves you an entire retry pass across the whole job.
The mistake is picking a single "best" provider for both. A team running an interactive agent and a nightly price-scrape often needs two different vendors, weighted differently. Match the vendor to each job before you consolidate on one.
Rendering well ≠ getting in the door
Everything above measures general JavaScript rendering across a mix of targets. There's a second, harder problem hiding inside that average, and it scrambles the rankings. Cloudflare.
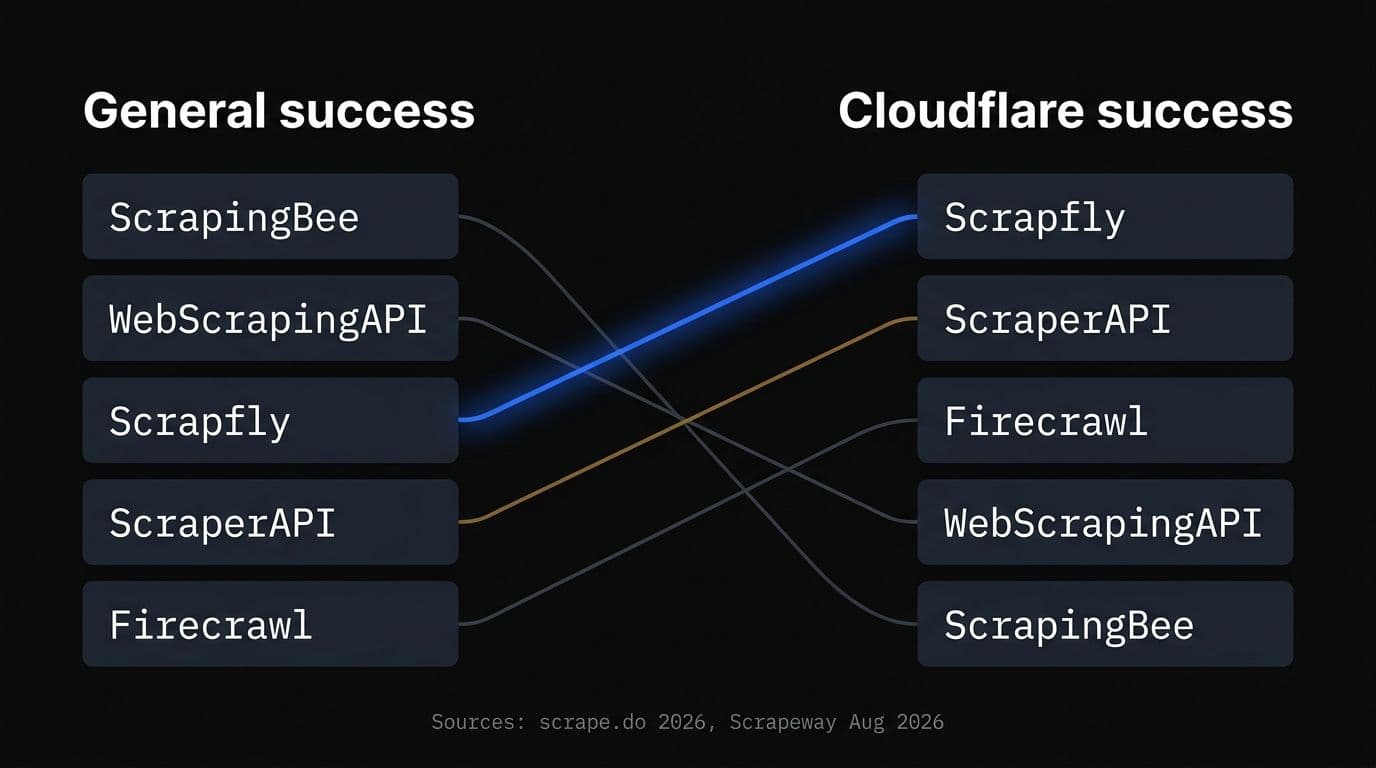
The clearest illustration is Scrapfly. It ranks 8th on general success at 93.86%, solidly mid-table. But on Cloudflare-protected targets specifically, it ranks 1st, at around 97%. ScraperAPI inverts the pattern, showing a middling 72.57% general success rate but only 48% against Cloudflare. A provider's overall number tells you almost nothing about how it performs on the sites that are hardest to reach.
The reason is that Cloudflare isn't a rendering problem, and rendering skill doesn't help you clear it. Before your headless browser ever executes a line of the page's JavaScript, Cloudflare screens three things on the same request:
- IP reputation asks whether this address is a known datacenter or a residential-looking one.
- TLS and HTTP/2 fingerprint checks whether the connection's handshake matches a real browser or a scripting library pretending to be one.
- The JS challenge is a computational proof-of-work that has to be solved and returned before any content is served.
A provider renders React flawlessly and still gets a challenge page 52% of the time because its IP pool is burned and its TLS fingerprint is off. That's exactly what a low Cloudflare number means. Rendering is table stakes for reading a modern site. Anti-bot evasion is what gets you to it, and they're solved by completely various infrastructure.
So your targets might sit behind Cloudflare. If you're scraping e-commerce or most consumer web, some of them do. The general success table above is the wrong one to optimize against. Test your actual targets before committing to any single provider.
Choosing by workload
There is no single best API here, only a best fit for what you're building. Three common workloads, three diverse answers.
RAG and agent pipelines
If you're feeding a retrieval system or an LLM agent, raw HTML is a liability, not a deliverable. You don't want a 400KB DOM with nav bars and inline scripts. You want clean, structured content your model actually uses, ideally as JSON or Markdown, with the boilerplate already stripped. The cost of parsing and cleaning HTML downstream often exceeds the cost of the request itself.
This is where DataBlue is built to fit. Our scrape API returns rendered pages as structured, model-ready output rather than dumping raw markup on you. It exposes an MCP interface so an agent calls it as a native tool without you writing glue code. We're deliberately not claiming a rank in the benchmark above. DataBlue wasn't in it, and inventing a number would make us exactly the kind of source this post was written to push back against. We're telling you what the tool is optimized for. That's output format and agent ergonomics, not a leaderboard position we didn't earn. Judge it against your own agent's tool calls before you commit.
Price monitoring at volume
When you're firing hundreds of thousands of requests a month, the effective-cost table is your entire decision. A $0.10 difference in cost per successful request is real money at that scale. Success rate matters more than latency because the work runs unattended. Optimize for the bottom-left of that table. High success, low advertised price, and a billing model that doesn't charge full freight for failures. ScrapingDog, scrape.do, and Decodo lead on that math today, so start your shortlist there.
One-off and low-volume work
If you're scraping a few thousand pages for a research project or a prototype, effective cost barely matters. The whole job costs less than lunch. What matters is friction. You want a authentic free tier and a five-minute path from signup to first successful request. This is also where "easiest to start with" beats "cheapest at scale." Prioritize documentation quality and a free allowance over decimal-point pricing differences.
If you want a structured way to weigh these factors against each other, our guide to choosing a web scraping API turns this into a decision checklist.
FAQ
Do I need a headless browser to scrape a React or Next.js site?Usually, but not always. If the site server-side renders or statically generates its content (Next.js with SSR or SSG), the initial HTML already contains the data and a plain HTTP request works. If it's a pure client-side React SPA that hydrates an empty shell, you need rendering. The raw HTML will be nearly empty. The fastest way to check is to fetch the URL with curl and search the response for your target text. If it's missing, you need a rendering API.
What's the easiest web scraping API for developers to start with?For a genuinely fast start, look for a real free tier, no credit card requirement, and a single-endpoint API you call with one GET request. ScrapingDog and scrape.do are both low-friction on that front. DataBlue's free tier plus MCP support is aimed at developers who want to be productive in one call rather than configuring a browser farm.
Which web scraping APIs support JavaScript rendering in 2026?All sixteen in the benchmark above support it. It's now table stakes. The differences that matter are success rate, wait-condition control, and post-render actions, not whether the feature exists. Bright Data, scrape.do, Apify, and ScrapingBee lead on measured rendering success.
Why did my scraper return an empty <div id="root">?That's the signature of a client-side rendered SPA. The root div is where React or Vue mounts the app after JavaScript runs. Your HTTP client received the HTML before any JavaScript executed. Switch to a rendering request (render=true or equivalent) and add a wait-for-selector on an element you know appears only after data loads.
Does JavaScript rendering cost extra?Almost always, yes. Typically 5-10× the credit cost of a non-rendered request, because the provider runs a real browser instead of a simple fetch. Always confirm whether a quoted price is the rendered or non-rendered rate before you commit to volume. It's the most common billing surprise in the category. See our pricing page for how DataBlue meters it.